A novel multi-dimensional visualization and analysis tool to interrogate immune micro-environments of tumors
Spatial architecture of the tumor microenvironment (TME), particularly in relation to numbers, subsets, locations and distances among immune cell populations, as well as their changes in time, are critical in understanding tumor evolution and response to therapy. The prognostic value of the immune contexture of the TME is best captured when multiple parameters are combined and inter-related, superseding the mere expression of single markers. To enable the search for contexture-based predictors, it is imperative to interactively visualize and interrogate immune micro-environments of tumors. To enable multi-parameter studies of the spatial architecture of the TME, novel multiplexed microscopy methods have been developed, such as those that make use of either repetitive staining and imaging, spectral deconvolution of overlapping fluorophores or mass cytometry coupled to ablation of tissues.
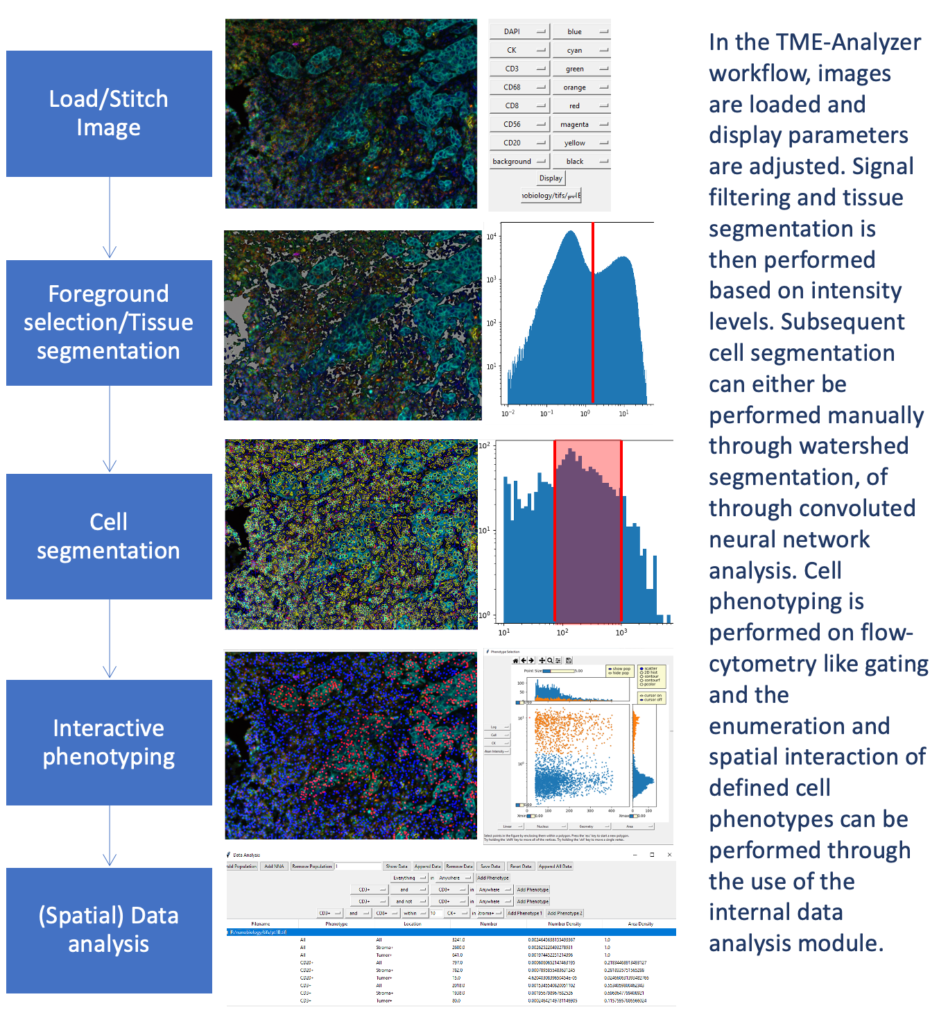
As different techniques have become widely available and complexity of images have significantly increased, consistent and user-friendly analysis of such data, and its relationship to clinical outcomes, have become more and more challenging. To address shortcomings in multiplex image analysis, I have developed TME-Analyzer: a python-based what-you-see-is-what-you-get (WYSIWYG) interactive graphical user interface (GUI) software. TME-Analyzer is a newly developed and guided-user interface with the unique option to gate according to cell characteristics and expression markers for quick and reproducible image and data analysis. TME-Analyzer is compatible with fluorescent and other high-dimensional images that have a nuclear marker for cell detection, and comes with integrated quantification of cellular and tissue phenotypes, their densities in defined compartments and their interspacing, as well as visualization and exportation of data. This tool has been so far utilized in analysis of various cancer types (e.g. early-stage ora cavity cancer, nasopharyngeal carcinoma, colorectal cancer, metastatic urothelial cancer, triple-negative breast cancer, prostate cancer, melanoma, etc.), and platforms (multiplexed immune fluorescence, multiplexed ion beam imaging by time of flight, immune histochemistry of in-situ hybridization).
While the manuscript is in preparation to release the software for general public use, TME-Analyzer is already is utilized in collaboration with various institutes (e.g. Erasmus MC, The Netherlands; Vrije Universiteit MC, Amsterdam, the Netherlands; Chinese University of Hong Kong, Hong Kong, China). If you also want to use TME-Analyzer for your image analysis, contact me at h.balcioglu@erasmusmc.nl.