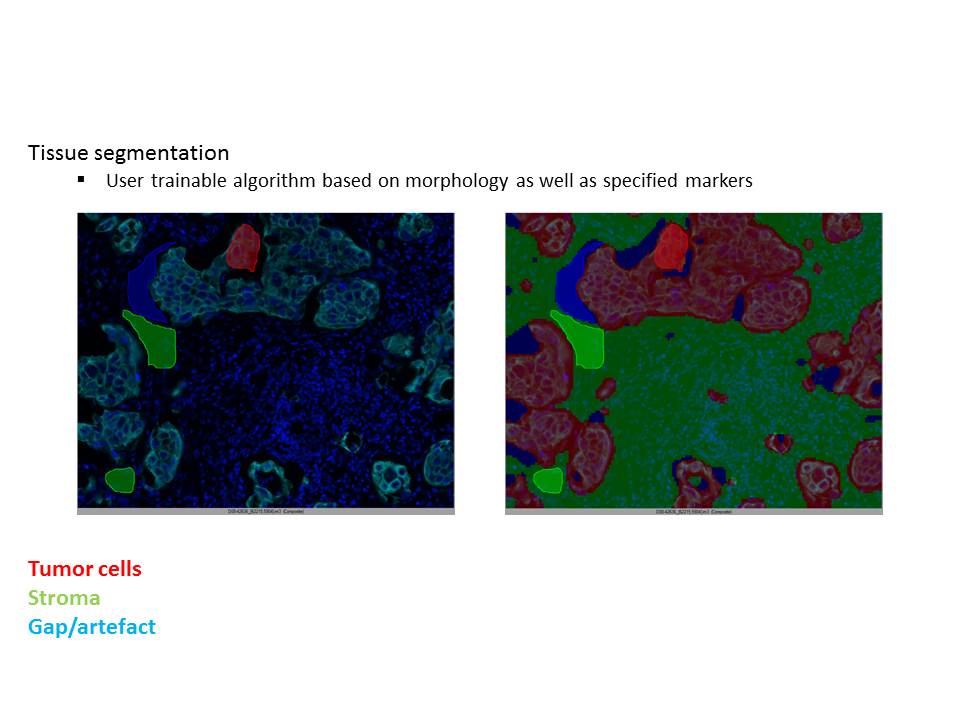
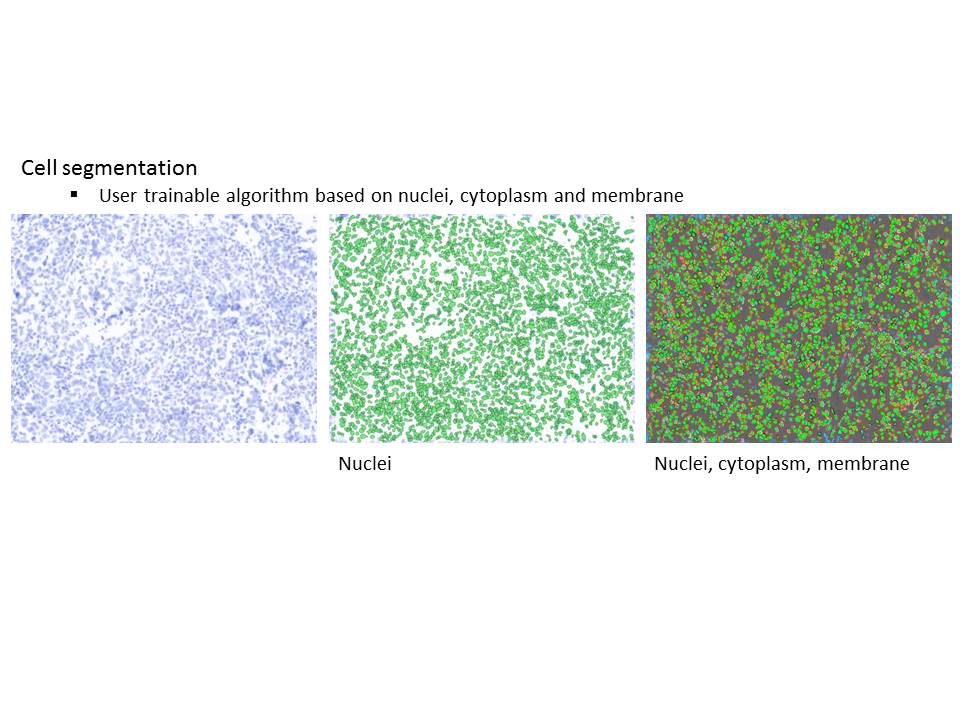
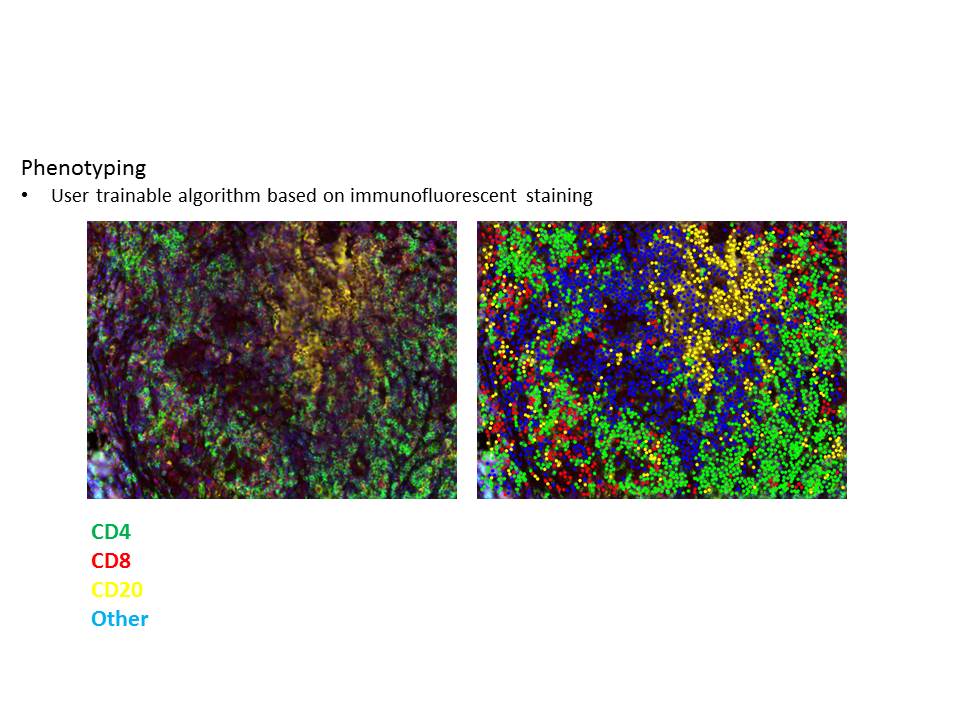
After obtaining the spectral information of the slides, the densities and localizations of proteins of interest and subsequently tissue and cell types are obtained through inForm® (Akoya Biosciences, Inc.) software. This is accomplished by unmixing the image through uncoupling individual fluorophores used to mark proteins of interest using the spectral image and images for single fluorophore controls. From the unmixed image the tissue is segmented as tumor, stroma and unoccupied areas, followed by segmentation of individual cells for tumor and stroma areas, and then finally phenotyping individual cells depending on the markers that are present in them.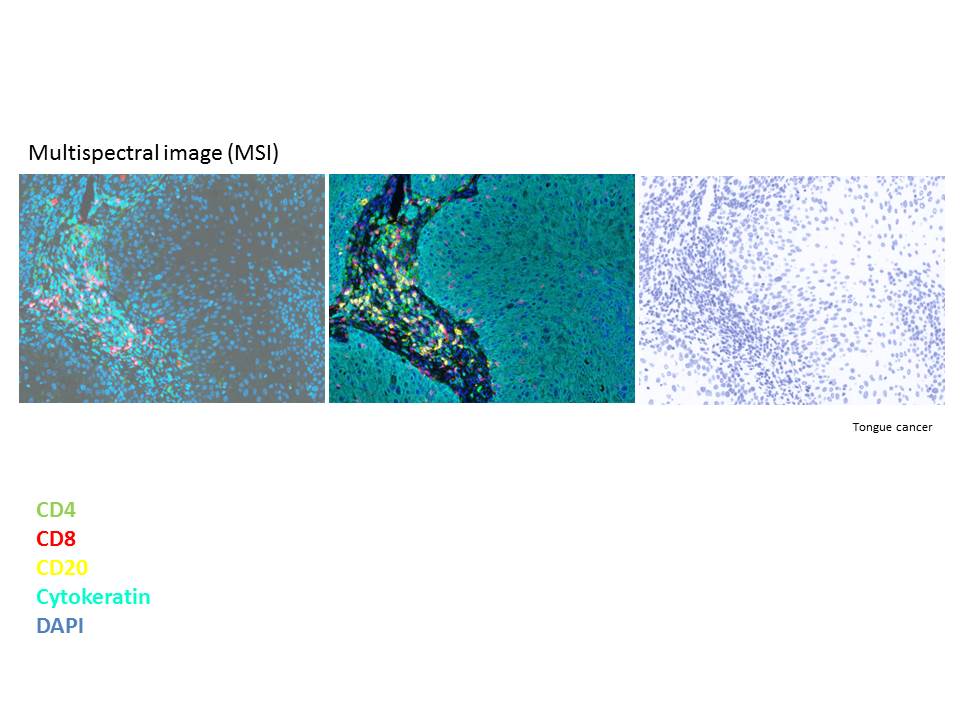
Data Analysis
Following the acquisition of the spatial information of individual cell types and their corresponding tissues, analysis for their densities, localization and possible inter-cellular interactions is carried on. For this purpose phenotypr package provided by Akoya Biosciences, Inc. as well as in house written codes are made use of.